Viewing traces and alarms of the runtime system in PLC Logging view
The PLC Logging →view captures all the →trace and alarm messages logged by the →runtime system on the PLC. By default, this view displays the messages for the PLC which a connection is established. The advantage of this view is that its content is listed in tabular form.
If the PLC Logging view is not visible in your application, you can add it to the current →perspective: Select Window – Show View – Other... – Other – PLC Logging.
| Good to know |
|---|
|
|
 If the PLC Logging view is empty and no messages for the
 | In this article: |
|---|
Components of PLC Logging
Columns in view
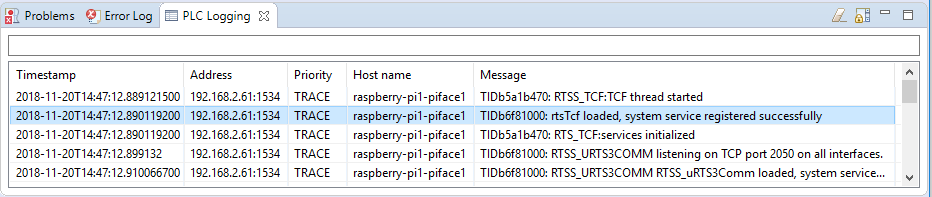
The following columns are visible within PLC Logging:
-
Column Timestamp indicates the date and time when the message has been logged.
-
Column Address informs about the IP-address and the port number of the PLC where the runtime system is operated. In case of a communication via Gateway, the IP-address and the port number of the Gateway is displayed.
This information matches to one in the appertaining PLC-object. -
Column Priority informs about the message type, e.g. whether it is a trace, error, warning or information.
-
Column Host name indicates the host name of the target system.
-
Column Message displays the actual text of the message. The messages are logged by the runtime system and are only available in English.
Toolbar for view
The view provides a toolbar with buttons which you might want to use to influence the displayed content in PLC Logging. See the following section for a list of possible actions.
Actions for PLC Logging
Filtering messages
You can filter the view to show messages with a particular text only:
-
Enter the filter text into the box displayed above the columns and press the Enter-key.
How to display all filtered-out messages:
-
Click into the box above the columns and delete the filter text previously entered.
Clearing the messages from the view
-
Click
 Clear logging view in toolbar of PLC Logging.
Deactivating automatic scrolling of messages
If the runtime system logs new messages, the view scrolls to the bottom by default. If you want to keep certain messages displayed, stop the view from scrolling as new messages are appended:
-
Click
 Scroll Lock in toolbar of PLC Logging.
Viewing traces of target systems without established connection
By default, the PLC Logging view displays the messages for the PLC which a connection is established.
If the PLC Logging view is to display the messages without an connection to the target system, you must define the environment variable RTS_LOG_UDP on the belonging target systems before the the runtime system is started on the target system. As value, first define the IP-address of the computer where Neuron Power Engineer is used, then add : and conclude with the port 7777. Hence, the value for a computer with IP-address 192.168.1.239 is: 192.168.1.239:7777
If you do not know the IP-address, ask your administrator for this piece of information.
Observe that the viewing of the traces in the view is only possible for certain target systems:
| Supported ( |
|---|
|
Windows-PC (according to system requirements) |
|
Linux-based target systems: |
| Not supported ( |
|---|
If you have installed and started the runtime system according to the tutorials (for Neuron Power Engineer version 1.58.0 or later and Neuron RTS max version 3.1.1 or later), the environment variable might already be defined. If you have started the runtime system without this defined environment variable, you are able to define this environment as follows:
Defining environment variable for the the runtime system under Windows
-
Terminate the runtime system on the target system.
-
Define the environment variable
RTS_LOG_UDP.
You are able to define environment variables by using the commandsetin a Windows command prompt. If in doubt, ask an administrator for support.
Example for defining the environment variable:set RTS_LOG_UDP=192.168.1.239:7777 -
Start the runtime system under Windows as described under "Starting the development environment and the runtime environment".
-
Change to the PLC Logging view. The start messages of the runtime system are displayed in the view.
Defining environment variable for the runtime system under Linux-based target system
-
Terminate the the runtime system on the target system.
-
Define the environment variable
RTS_LOG_UDP.
You are able to define environment variables by using the commandexporte.g. in a terminal window of PuTTY. If in doubt, ask an administrator for support.
Example for defining the environment variable:export RTS_LOG_UDP=192.168.1.239:7777 -
Start the runtime system on the target system as described in the tutorials. Example: For Raspberry Pi, these instructions are listed under "Installing and starting the runtime system on Raspberry Pi".
-
Change to the PLC Logging view. The start messages of the runtime system are displayed in the view.